How dry has it been this year in your region and how much insurance would help to protect against losses? Our GrECo Soil Moisture Deficit Monitor can provide the answer about 10 850 locations in Central and Eastern Europe!
2022 breaks all records in some parts of Europe, being one of the driest and hottest years! The dynamics of soil moisture in dry 2022 compared to 2021 can be clearly seen in the video below.
The browner the area in the chart above remains for a significant time (more than 30 days), the more hostile the drought is.
Drought negative outcomes
Such a big drought leads to many negative consequences in many industries, especially in agriculture, energy, logistics, and forestry. For example:


Why is drought on the rise?
This is believed to be the result of a global warming trend that is due to intense human activity, especially in the last 50 years. We witness the increase in greenhouse gas in the atmosphere (more than 30% compared to the 1950s) and deforestation for agriculture (40% of forests were lost). It led to the shift in the average temperature by 1°C compared to the pre-industrial era, and thus resulted in large changes in the weather produced by ocean streams. This is evidenced by more extreme temperatures, heat waves, higher wind speeds, more hail, and uneven distribution throughout the season leading to no rain when plants need it or, vice versa, heavy destructive rains and floods.
How to quantify the severity of a drought event?
To quantify and visualize it, we use soil moisture data set from ‘ERA5 hourly data at single levels from 1959 to present’, provided by the European Space Agency. The data is stored in 25 x 25 km grids as in the picture below.
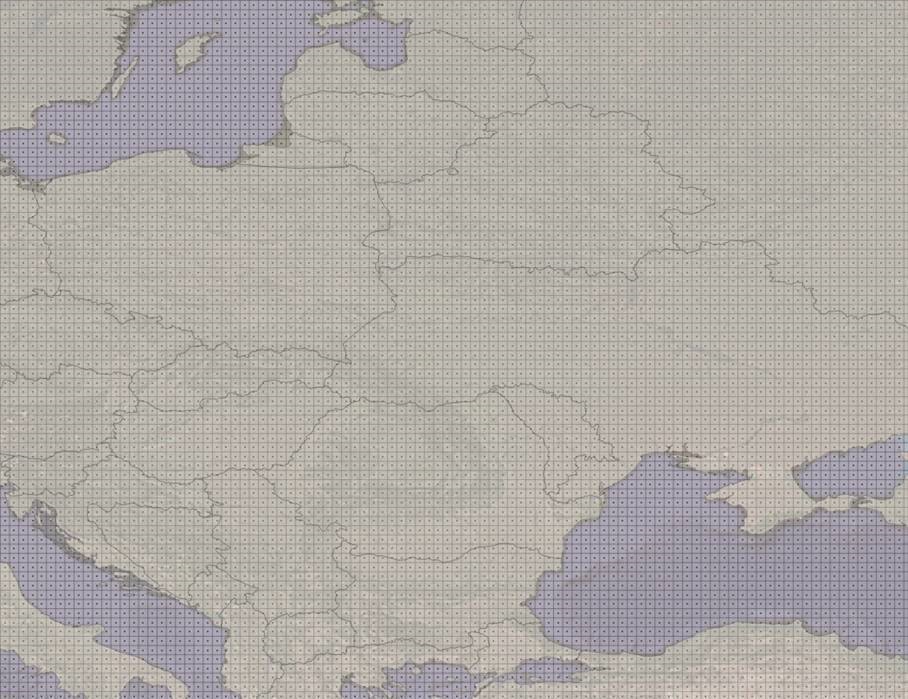
We have developed a monitor tool that clients can use to get calculations from us by sending individual requests. Once we identify your location in CEE/SEE region from the drop-down list, a simple Excel tool will identify the ERA5 grid and extract data for further analysis and calculations.
Examples from several places are as follow.


As we see from the charts above, in areas around Debrecen and Bratislava, the 2022 year was the worst compared to the last 30 years, at least. For example, in Debrecen, it was 45.8% dryer than the average year in this region. The farmers would get insurance compensation in the amount of 25% of crop value if they signed a parametric drought insurance policy.
Why is the satellite soil moisture index the best parameter to insure drought?
Sources:
https://www.fao.org/newsroom/detail/cop26-agricultural-expansion-drives-almost-90-percent-of-global-deforestation/en
https://cds.climate.copernicus.eu/cdsapp#!/dataset/reanalysis-era5-single-levels?tab=form
https://www.weforum.org/agenda/2022/08/drought-impacts-europe-unexpected/
https://effis.jrc.ec.europa.eu/apps/effis_current_situation/
https://effis.jrc.ec.europa.eu/apps/effis.statistics/estimates
Related Insights
GrECo invests in Corporate Trust to Expand Strategic Risk Management Capabilities
GrECo Group is proud to announce a strategic investment in Corporate Trust, a Munich-based company renowned for its expertise in cybersecurity consulting and classic security business.
Pillar of Our Strategy Is Specialisation – Interview With Georg Winter
Georg Winter offers some insights into his vision for GrECo. Interview was originally published in Lockton Global Partners Magazine.
‘Our only focus is on our client’s and people’s needs’
Ante Banovac shares his thoughts about future risks facing the insurance industry and the state of the insurance market in Serbia, Slovenia and Croatia

Maksym Shylov
Head of Complex Property & Liability Solutions, Baltic States
T +371 25 480438